
How Economically Free is Your Metro Area?
At the end of January, the Reason Foundation released the U.S. Metropolitan Area Economic Freedom Index (MEFI), authored by Dean Stansel of the O’Neil Center for Global Markets and Freedom at Southern Methodist University. This index, like the Economic Freedom of North America (EFNA) index on which Stansel is the lead author, seeks to empirically measure how economic freedom varies across jurisdictions. Whereas the EFNA measures how economic freedom varies across the US states, Mexican states, and Canadian provinces, the MEFI measures how economic freedom varies across the 382 metropolitan areas in the US. I’ll give you the punchline of the report right upfront: economic freedom is correlated with a variety of measures of prosperity. Though many make this claim, this index provides the data to back it up.
Before discussing the findings of this latest economic freedom report, it’s important to define just what we mean by economic freedom. According to the first Economic Freedom of the World Report:
Individuals have economic freedom when (a) property they acquire without the use of force, fraud, or theft is protected from physical invasions by others and (b) they are free to use, exchange, or give their property as long as their actions do not violate the identical rights of others. (Gwartney, Lawson, and Block, 1996: 12).
These various indices of economic freedom, therefore, roughly measure how free from government interference an economic system is, and the extent to which voluntary, private transactions are allowed to coordinate economic activity.
As the EFNA details, economic freedom varies substantially across the states. It’s probably unsurprising to you to hear that Florida, New Hampshire, and Texas take the highest three spots in the cross-state index, or that New York, Kentucky, and West Virginia are the three least free. Yet economic freedom can vary substantially within a given state, too. Take Florida, for instance. The MEFI finds that the Naples-Immokalee-Marco Island metropolitan statistical area (MSA) is substantially more free than the Panama City MSA. Or consider Texas. The MEFI rates metro areas on a ten point scale – and the Midland MSA is more than two points higher than the McAllen-Edinburgh-Mission MSA.
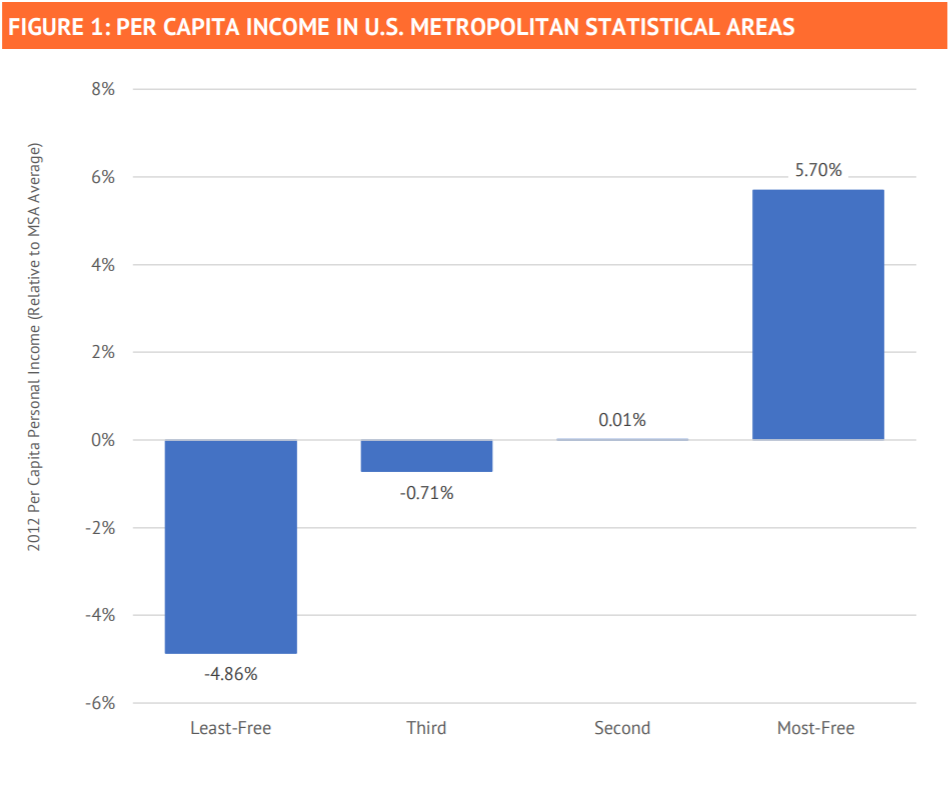
These variations in economic freedom have real consequences. As the report details, income per capita is considerably higher in the most free quartile of MSAs than in the least free quartile. The top 25% of MSAs in the report have an average per capita income that is 5.7% above the average of all MSAs, while the bottom 25% have a per capita income that is 4.9% below average.
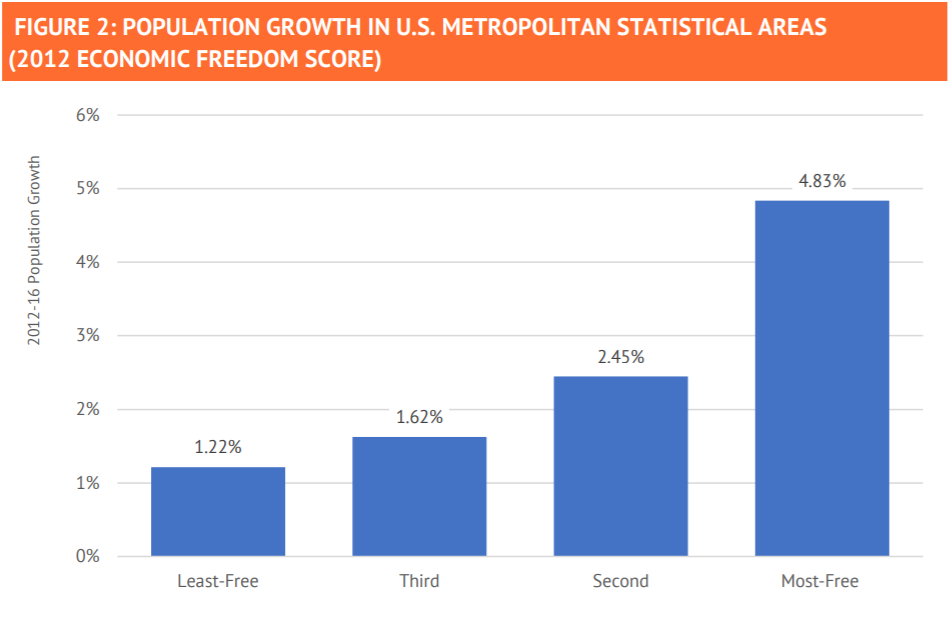
People also demonstrably prefer to live in areas with higher levels of economic freedom. While the bottom quartile of MSAs saw a population growth rate of 1.2% between 2012 and 2016, the top quartile saw a population growth rate of 4.8% – four times the growth rate of the lowest!
In many ways, these indices are concerned with helping us to understand the fundamental question of economics: why it is that some places are rich and others are poor. An increasingly large body of research tells us that economic freedom is at least part of the answer.
All of the data used in the construction of the Metropolitan Economic Freedom Index are available for free download from the Reason Foundation’s website. Additionally, you can find data for both the Economic Freedom of North America index and the Economic Freedom of the World index at FreeTheWorld.com.
In his foreword to the first Economic Freedom of the World report, Milton Friedman made the following statement:
Freedom is a big word, and economic freedom not much smaller. To talk about economic freedom is easy; to measure it, to make fine distinctions, assign numbers to its attributes, and combine them into one overall magnitude—that is a very different and much more difficult task.
Dean Stansel has provided the most fine-grained analysis of economic freedom in the U.S. available to date. I encourage everyone to check out the data – and to see where your metro area ranks. If you rank lower than you would like, just remember: the first step to recovery is admitting you have a problem.
Posts you may like
-

“The Brutalist”: A Modern Exercise in Classical, Epic Filmmaking
March 26, 2025
-

Why Consumers Should Boycott Octopus Farms
August 7, 2024
-

Cloud Services Expose The Balancing Act Between Security And Privacy
June 26, 2024
-

5 Things To Remember When Sharing Space With Wildlife
June 4, 2024
